AWS Cloud Operations & Migrations Blog
A detailed overview of Trusted Advisor Organizational Dashboard
As your business grows on Amazon Web Services (AWS), so too does the need to ensure your resources are optimized and following AWS best practices. AWS Trusted Advisor identifies ways to improve your AWS infrastructure across 5 unique pillars: Security, Performance, Cost Optimization, Fault Tolerance, and AWS Service Quotas. The AWS Support API allows customers to extract Trusted Advisor data programmatically for each individual account, and the Trusted Advisor Organizational view feature provides a unified view of all Trusted Advisor recommendations for all AWS accounts within your organization. The Organization view report is available in JSON or CSV format. Customers often find challenges when using the report and require additional efforts to identify actionable insights, share it with leadership or technical teams within their organization, and analyze monthly trends. In addition, customers with multiple AWS Organizations have a need for a holistic view of their Trusted Advisor checks across every one of their AWS accounts.
In this blog post, we will introduce you to the Trusted Advisor Organizational (TAO) Dashboard, an interactive and customizable Amazon QuickSight dashboard template as part of the Cloud Intelligence Dashboards framework. By visualizing your consolidated Trusted Advisor reports, your organization can optimize for a more cost-efficient setup, stronger security posture, and better performing applications across all of your AWS accounts.
Behind the scenes
The Trusted Advisor report is the dataset used by Amazon QuickSight to visualize your Trusted Advisor flagged resources. Once the dashboard is deployed, the data presented can be useful to many areas of a business, and can be used as a starting point for custom dashboards. The Well-Architected lab on the TAO Dashboard will provide step by step instructions on how to deploy the TAO Dashboard including how to automate the collection of Trusted Advisor data by using the Optimization Data Collection Lab. Under the hood serverless services such as Amazon S3, AWS Lambda, Amazon Athena, and Amazon QuickSight to power the TAO Dashboard.
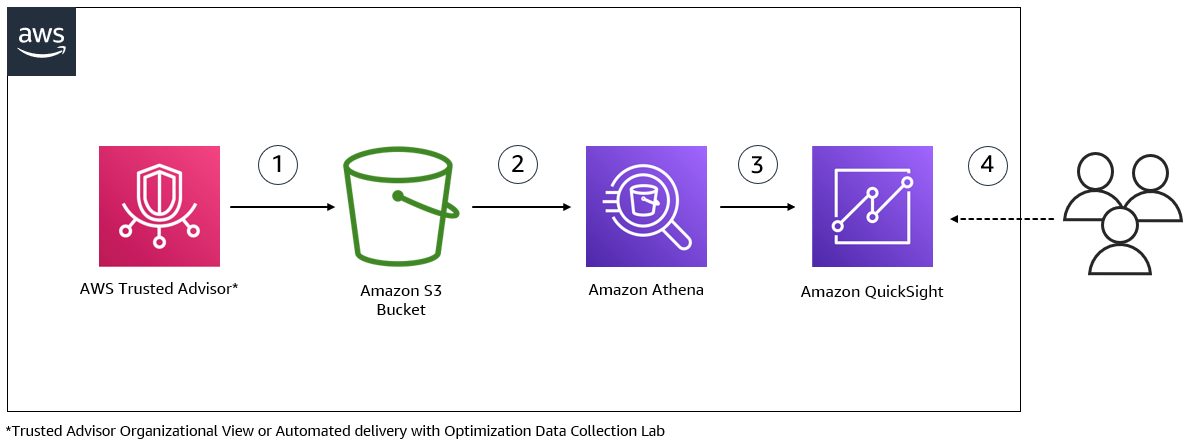
Figure 1. Reports from AWS Trusted Advisor service are stored in an Amazon S3 bucket (1). An Amazon Athena table and view is used to query data from the S3 bucket (2). Amazon QuickSight uses the Athena view as a source to load data into QuickSight’s SPICE storage and visualizes the data in the dashboard (3). The TAO dashboard can be shared with different users within your organizations to have quick and easy access to Trusted Advisor flagged checks across the entire organization (4)
The Trusted Advisor Organizational Dashboard
The TAO Dashboard is organized into eight sections; the Summary sheet, individual category sheets for the 5 Trusted Advisor categories (Security, Cost Optimization, Resiliency, Fault Tolerance and Service Limits), a Security Hub Checks sheet, and a Well-Architected Reviews sheet. The Summary sheet is a generalized overview of each of the Trusted Advisor categories organized by the different checks in each category, as well as visuals breaking down the Trusted Advisor results by AWS region, and the accounts with the highest number of flagged Trusted Advisor checks. The category sheets contain more granular details including individual resources and will allow customers to prioritize improvements based on the impact they will make. In addition to this, the dashboard includes a description of what the check is looking for, why it is important to acknowledge, and insights into how to address it. On the Security Hub Checks sheet, you can find the results from any accounts where AWS Security Hub has been enabled. When the Trusted Advisor integration has been enabled on a Well-Architected Review (WAR) within your organization, the Well-Architected Reviews sheet of the TAO Dashboard presents any High Risk Issues (HRI) identified in a succinct manner. This tab provides another way to organise the Trusted Advisor results, and is intended to help you track the resolution of these HRIs against a particular workload.
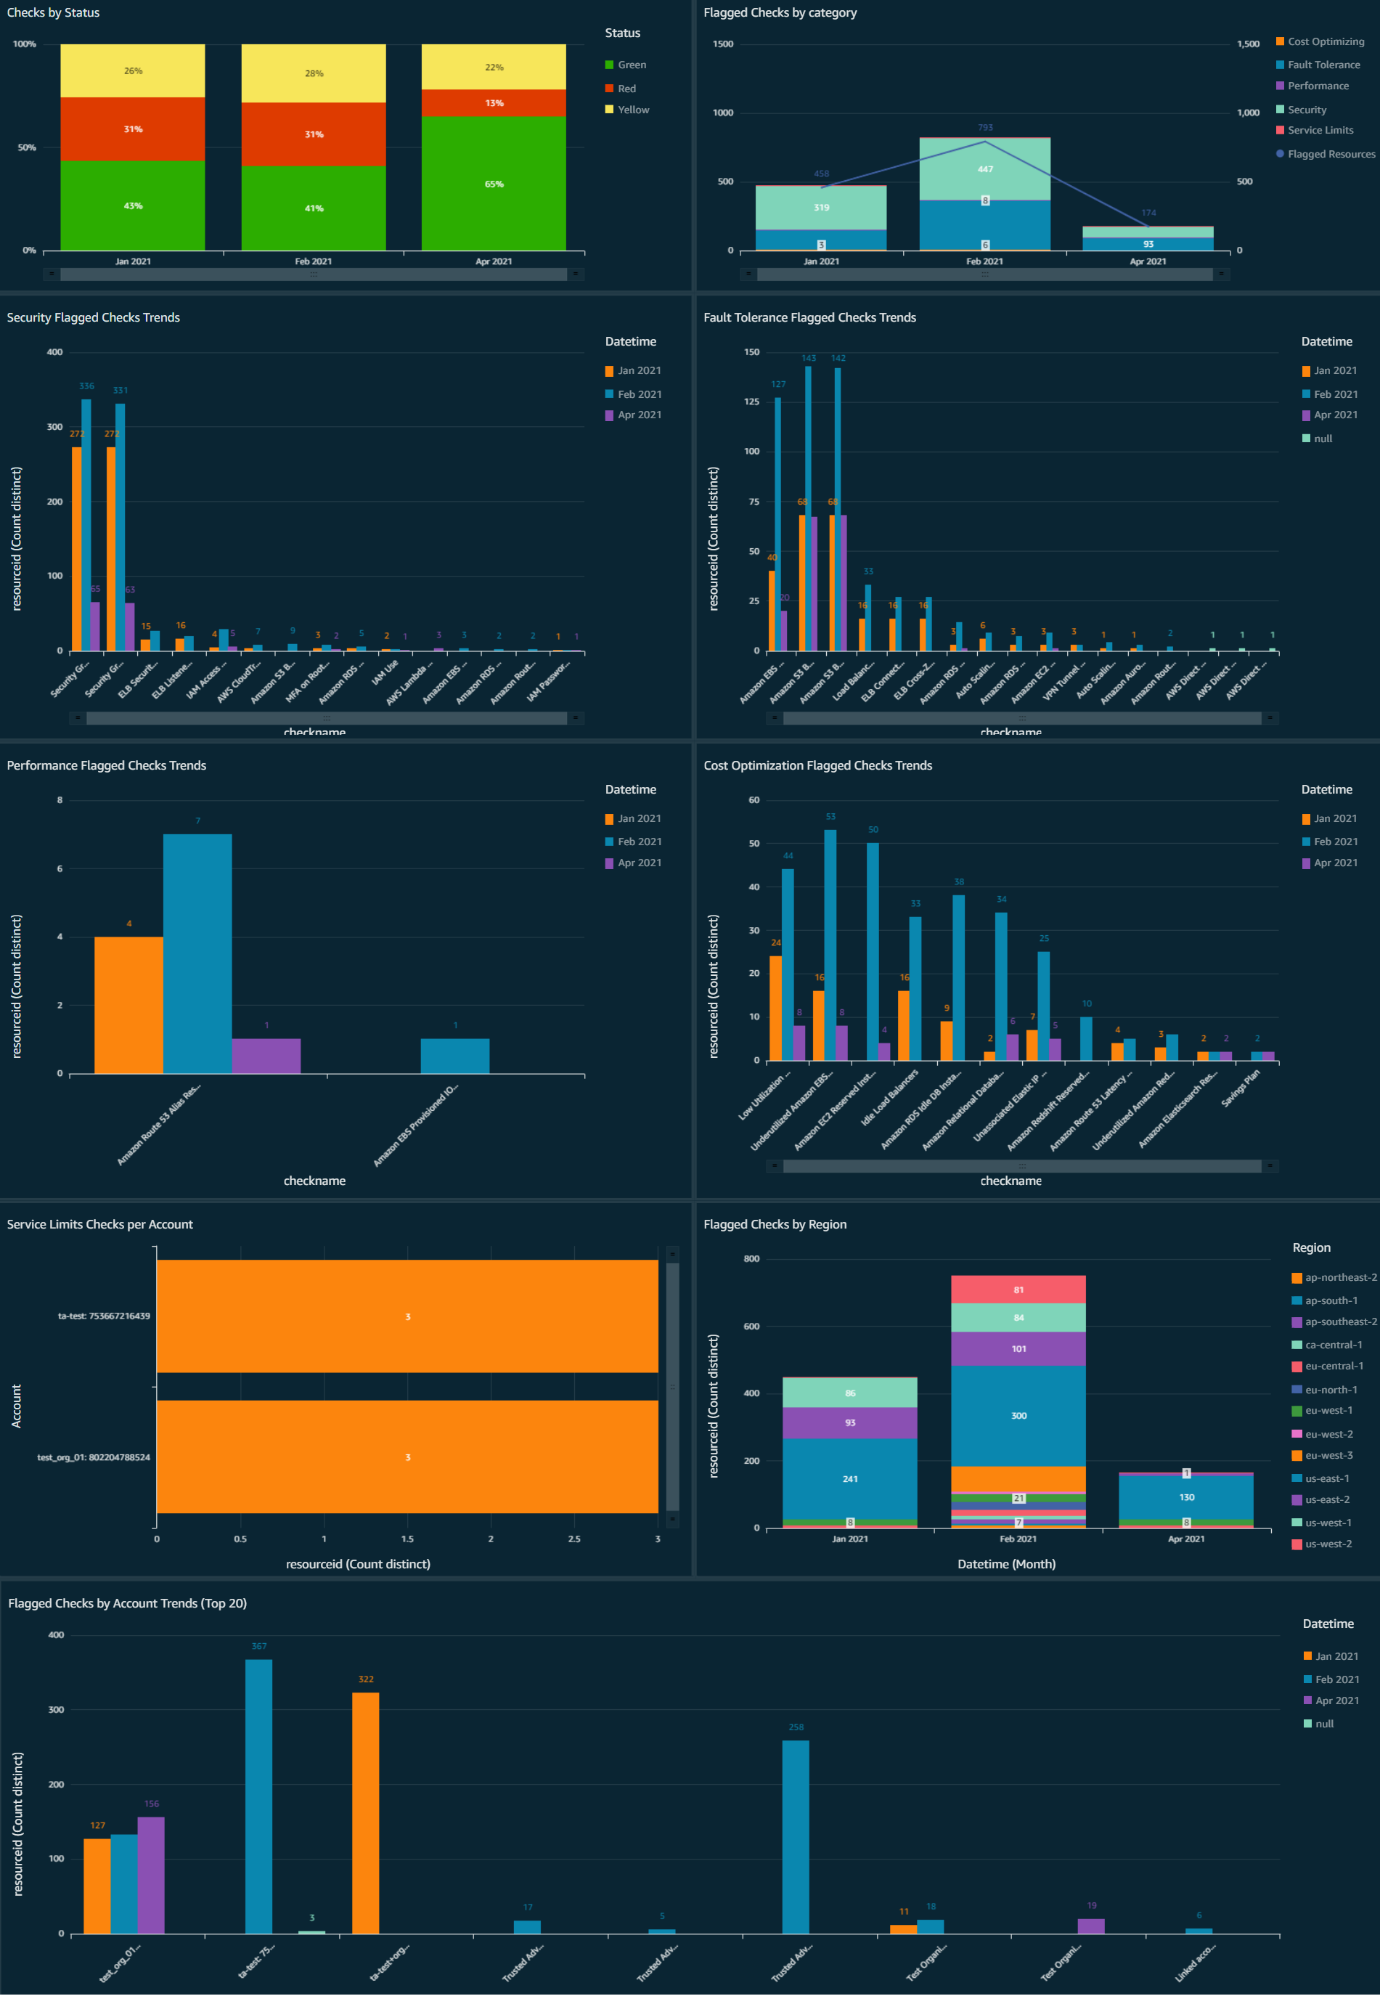
Figure 2. A sample of the Summary tab of the TAO Dashboard. There are 9 graphs which allow you to identify flagged resources against different dimensions which highlights monthly trends.
Let’s look at the Security checks in a little more detail….
Security at AWS is job zero, and so it makes sense that the first granular data presented in the TAO Dashboard is related to the Trusted Advisor Security Checks. On the Security tab you can find detailed data on the most important security-related checks performed by Trusted Advisor where you can address things like AWS Identity and Access Management (IAM) access key rotation, IAM password policy requirements, Multi-factor authentication on Root account, and Exposed access keys.
Many of the checks are presented through multiple visuals and a table of flagged resources. Where applicable, a chart showing the number of resources flagged per month in each account, or another factor like the reason for the resource being flagged, provides a high level overview across your entire organization. The detailed table allows you to dig into the specifics and sort the results based on a number of factors including AWS account, AWS region, or status.
If you dive into the IAM access key rotation check, you’ll see the detailed view includes the Account ID, the individual IAM user, the timeframe threshold (> 90 days, > 2 years, etc.), the name of the access key, the date it was last rotated, alert level (Yellow or Red), the date the resource was first flagged by Trusted Advisor, and the most recent date when this resource was flagged for that check. Using this table, you can sort by any of the columns to focus on what matters most to your organization. For you this might mean putting a focus on the most critical accounts or maybe you’d rather focus on the oldest keys first. While it’s up to you to prioritize, the TAO Dashboard makes it easy to sort your results, giving you a way to find who the access key belongs to, and when the key was last rotated across all your AWS environments.
Cost Optimization made simple…
Cloud Financial Management is a growing focus of businesses that run workloads in the cloud. Your costs can increase when resources are left running unnecessarily, or when related resources are not cleaned up properly after decommissioning a workload. On the Cost Optimization tab you can find detailed data on the most important cost-related checks performed by Trusted Advisor which allows you to quickly identify idle resources like Amazon RDS Idle Instances, Low Utilization Amazon Elastic Compute Cloud (Amazon EC2) Instances, Underutilized Amazon Elastic Block Store (Amazon EBS) volumes, and Unassociated elastic IP addresses.
Help your teams detect underutilized instances, orphaned Elastic IPs, idle load balancers, and more in the Cost Optimization area of the TAO Dashboard. Use the pivot tables included with each check to sort or filter based on what is important to your business, and will make significant impact with low effort. For example, the idle load balancers identified because they have no backend instances attached, and the Elastic IPs which are unassociated can usually be cleaned up with low effort, while the impact of this effort can be high depending on the number of resources classified in this way.
Trusted Advisor Cost Optimization checks cover more than just unused resources. Some of the other findings in this sheet of the TAO Dashboard require more consideration before actioning, but the potential savings make it a worthwhile effort. Low Utilization Amazon EC2 instances or Idle Amazon RDS instances don’t automatically mean the resources can be terminated, they might be for test environments or batch operations that don’t run regularly. In those cases, resizing the instances or implementing some auto shutdown rules will optimize the cost of that low use environment.
Resiliency risks highlighted…
Most of us have heard the famous quote from AWS VP & CTO Werner Vogels, “Everything fails all the time”. In order to keep critical workloads operating in the event of an AWS Availability Zone or Service event, they must be designed for failure. The Fault Tolerance sheet brings a focus to the resiliency of your workloads and data across AWS. Here we include data on the most important Fault Tolerance checks performed by Trusted Advisor which allow you to look into the redundancy of Amazon EBS Snapshots, Amazon RDS Backups, Amazon RDS Multi-AZ, Amazon EC2 Availability Zone Balance, and more.
By ensuring workloads are as resilient as possible, your teams can spend less time firefighting and more time improving the application, and operations around it. Your business can use this data to pinpoint outdated snapshots of important EBS volumes, ensure critical production databases are deployed across multiple Availability Zones, and discover critical S3 buckets which are susceptible to data loss due to versioning not being enabled.
Keep your applications performing their best…
When your systems and applications are not performing their best there are side effects like unnecessary cost, user impact, and potentially even lost revenue. The Performance sheet of the TAO Dashboard focuses on identifying resources where performance may be degraded, whether that is due to overutilized instances, security groups with too many rules or high latency. Here we include data on the most important Performance checks performed by Trusted Advisor including High Utilization Amazon EC2 Instances, Large Number of Amazon EC2 Security Group Rules Applied to an Instance, Amazon Route 53 Alias Resource Record Sets, CloudFront Header Forwarding and Cache Hit Ratio, and CloudFront Content Delivery Optimization.
Use the visuals on the Performance sheet to optimize your workloads so they can behave their best and handle any volume of traffic that comes along. If your user base is global, think about using CloudFront instead of pointing directly to an S3 bucket. This will cache the content at edge locations, improving performance for your end users. Streamline your Security Group rules and ensure they allow only the required access inbound. While this is also a security related improvement, it impacts performance too. When system ports are opened to the internet, it can result in attempted connections. That increased traffic is going to use more resources than expected, and in turn impact the legitimate traffic.
Don’t let Service Quotas become a wall to innovation…
Service Quotas help ensure all customers can get access to the AWS cloud resources they need. However, these limits can become a blocker when teams are in the midst of building solutions to your business problems. Trusted Advisor will flag any Service Quotas where your account is using at least 80% of the provisioned resources. The TAO Dashboard provides a high level view of the limits which have reached the 80% threshold, and a breakdown of the limits flagged against the AWS account so you can easily identify higher risk accounts first. You are also presented with a detailed table of all Service Quotas flagged by Trusted Advisor. Using the table you can filter based on account ID, region, or check name, and action Service Limit increase requests across your whole AWS estate. Getting ahead of Service Quota increases means your team will be empowered to build on AWS without pausing for approvals to take place.
Conclusion
In this blog post, we shared some ways to use the TAO Dashboard to improve the security, performance, and fault tolerance of your AWS resources. You also learned about some of the ways the TAO Dashboard can help you manage costs and service limits across your entire organization. Get more familiar with the full range of Cloud Intelligence Dashboards using the live, interactive demo dashboard available. Check out one example of how our customers have used the Cloud Intelligence Dashboards to bring down their compute spend so they could keep scaling their business. If you deploy the TAO Dashboard to improve your workloads or lower costs, we’d love to hear from you!
About the authors: